Sometimes it helps to provide some historical context for currently observed phenomena. The chart below shows total federal, state, and local social benefit spending for the United States since 1960, the 25th anniversary of Social Security and five years before Medicare and Lyndon Johnson’s “War on Poverty,” with a menu featuring both “Guns and Butter.”
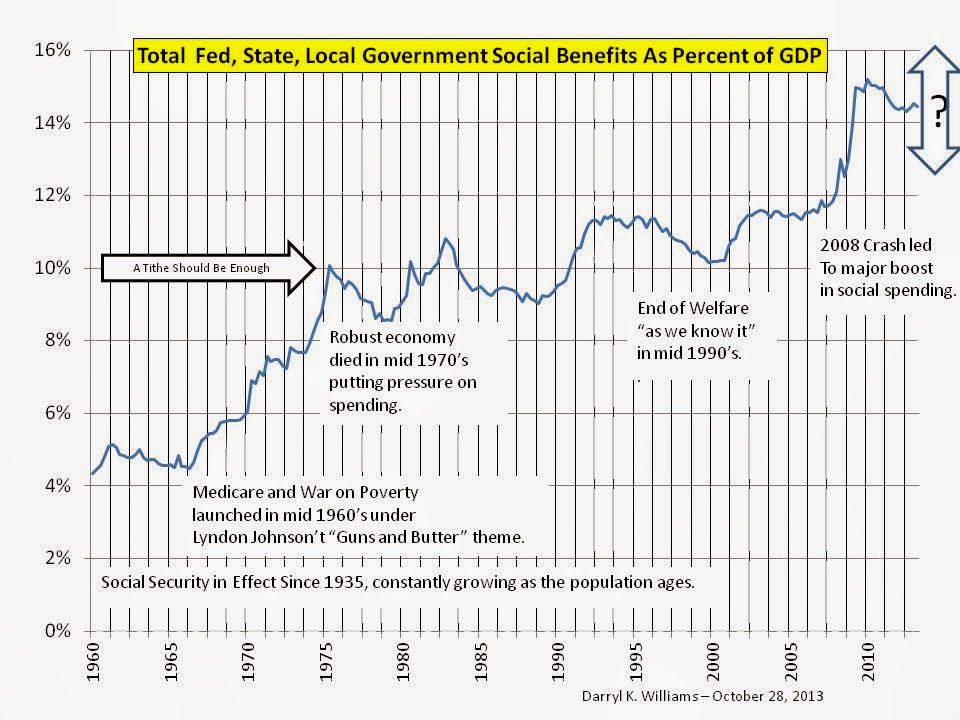
I’ve written several times about the major shift in direction for the US economy in the mid 1970’s (Search this blog for 1974), and one likely effect of that can be seen in this chart, growth in social spending slowing dramatically about that time. In 2000, after President Clinton and the conservative congress of his time collaborated to end “welfare as we know it,” total social benefits as a percent of GDP fell to 1975 levels. We see a little jump in the early 2000’s, maybe due to the Medicare Drug Plan, and then a rise above 14% with the social spending done in response to the 2008 real estate crash.
So, here we are, facing an uncertain economic future, a poverty level essentially the same as fifty years ago when the “War on Poverty” was launched, a national debt of $17T, greater than our current annual GDP, and still borrowing about a third of everything the government spends. Our economic future is looking pretty dim.
Here is my suggestion: Lets pin total social benefit spending at 10% of GDP. That’s a tithe, and, combined with all the voluntary giving our generous citizens do, should keep poverty in control. And, if we stop committing social benefits to folks who really don’t need them, people like me for example, there will be plenty to help the truly helpless even while cutting Social Security and Medicare tax rates on the productive young people who will spend or invest the money elsewhere.