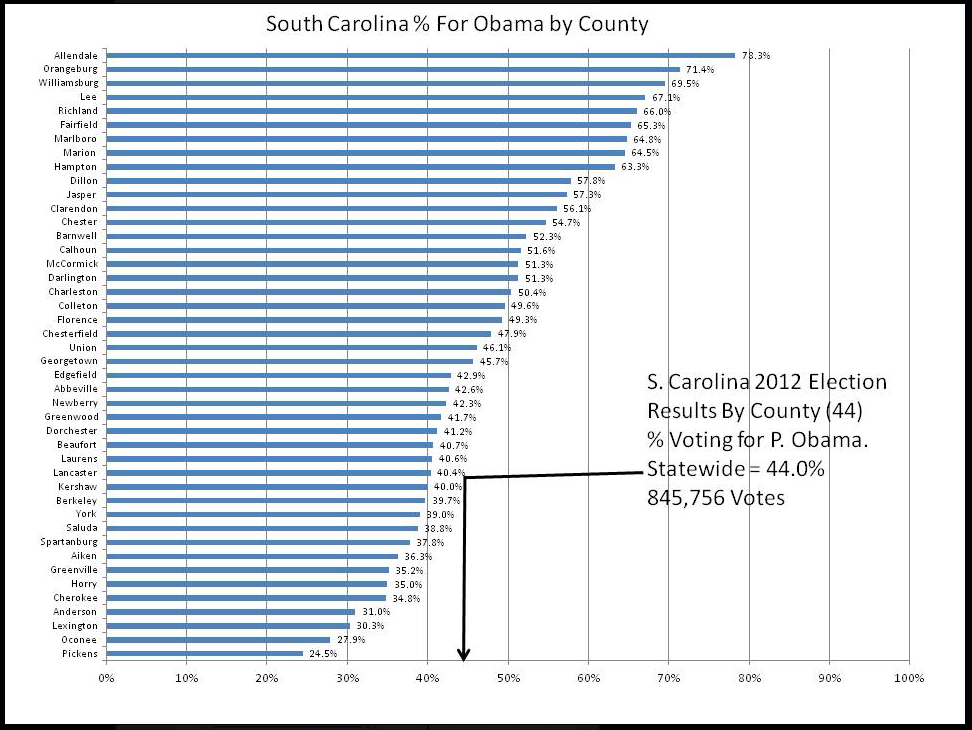
In famously Red South Carolina, voting only 44% for President Obama in 2012, I live in Richland County, home of the University of South Carolina and the SC State Capitol Building which still bears the marks of General Sherman’s cannon balls. Richland County voters awarded 66% of their votes to the president, 150% of the statewide average.
I can walk out my front door, stroll a thousand feet across the Gervais St. Bridge over the Congaree River and find myself in Lexington County, home of Fortune 500 SCANA headquarters, previously in Richland County, The SC State Farmer’s Market, previously in Richland County, and a huge new Amazon regional distribution center. The president only got 30% of the votes cast in Lexington County, two thirds of the statewide average. Is it any wonder that regional cooperation between Lexington and Richland Counties is problematic or that competition between them for private investment is intense…or that Lexington County is winning that competition?
The real conservative stronghold for South Carolina is the “Upstate,” Spartanburg and Greenville counties, 38% and 35% respectively for President Obama. These counties are famous for attracting foreign investment from such as BMW and Michelin and for developing their downtown areas to make them safe and attractive places to live.
At the other extreme in South Carolina are the poor counties in the so-called education “Corridor of Shame,” headed up by Allendale County on the Georgia–SC border, population ~10,000, awarding the president 78% of its votes. Senator Barack Obama visited one of the schools in the “Corridor of Shame” during his first presidential campaign. At that time, he was still focused on making a broad appeal and getting elected and took a fairly conservative position: “Obama says improving schools is not always about money. He says parents can help by restricting TV and video game time, and working against what he called “anti-intellectualism” – especially in minority communities.” Is it any wonder that the citizens of these poor counties look to Washington, DC, for assistance they don’t get from South Carolina?
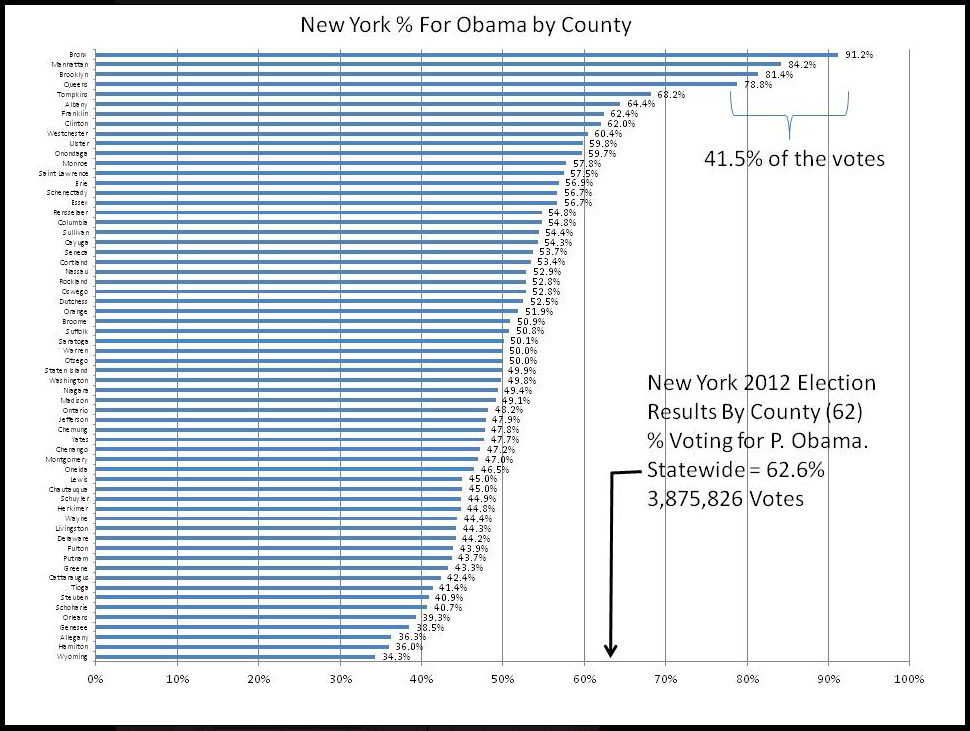
Now, shifting attention to famously Blue New York, we find the extremes in The Bronx, 91% for President Obama, and tiny Wyoming County, about 42,000 people living just east of Buffalo and giving the president only 34% of their votes. I have a grandson who is going to grow up in Brooklyn County, 81% for Obama, but my only residential experience in New York was two years in Monroe County, home of Rochester, the almost defunct Eastman Kodak, Rochester Institute of Technology, Xerox, Bausch and Lomb, and scores of other businesses and about 80,000 people below the so-called poverty line. Monroe County gave 59% of its votes to President Obama, an impressive majority but quite a bit below Richland County, South Carolina’s 66%.
Students of politics, demographics, and economics could spend years and write volumes about why people vote the way they do, and I’m not going to try to explain that in a few paragraphs on a blog. My objective is just to help steer people away from categorizing folks based on the state or county or city they live in and to debunk the idea that New York could secede from the union and leave behind all the country bumpkin red neck conservatives clinging to their guns and religion or that South Carolina could secede from the union and leave behind all the liberal commie pinkos advocating abortion, same sex marriage, and free cell phones for everybody. Both would find the same controversies continuing to rage in their new separate and independent entities. And they would have to start focusing on border control. We are just going to have to figure out how to get along with each other and reach some agreement on how much effort to devote to wealth generation (GDP growth) and how much to devote to wealth redistribution. We had better get it right.
By the way, as an afterthought I checked my hometown county, Blount County, Tennessee, Smoky Mountain home of Scots Irish settlers and their independent-thinking descendants It is a prosperous county that gave only 26% of its votes to President Obama. I suppose I come by my conservative leanings honestly.
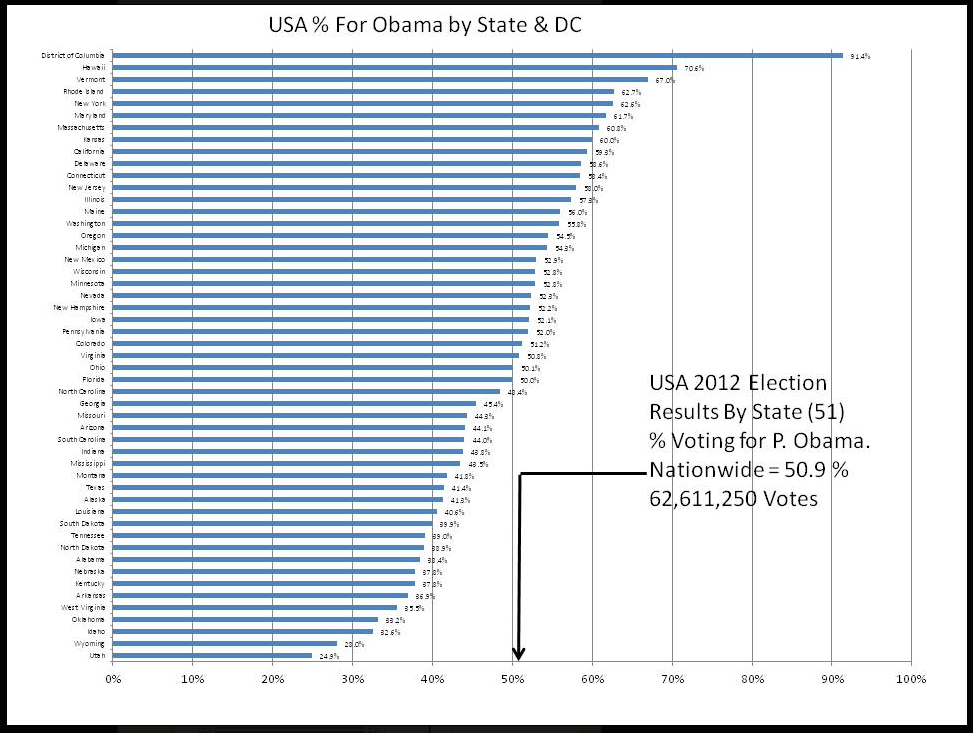
Below are the county charts for New York and South Carolina and a chart for the individual states. I suppose it is just coincidence that the state of Wyoming and Wyoming County, NY, both gave President Obama 34% of their votes. And no surprise in the District of Columbia matching New York’s Bronx County at 91%+ for the president. It should be clear from these charts that coloring everything red or blue is overly simplistic and counterproductive. There is about the same variation within states as there is among states.