In the 110 years since the Sixteenth Amendment authorized the personal income tax, we have created an expensive and burdensome monster with tentacles in our systems for welfare, health care, and education, and in the private business of citizens. Consider some data provided by our federal government.
The last full year for which the Internal Revenue Service has published its annual summary of personal income tax return data is 2016. I downloaded and examined some of the data to see what I could learn from it. Here are some basic facts:
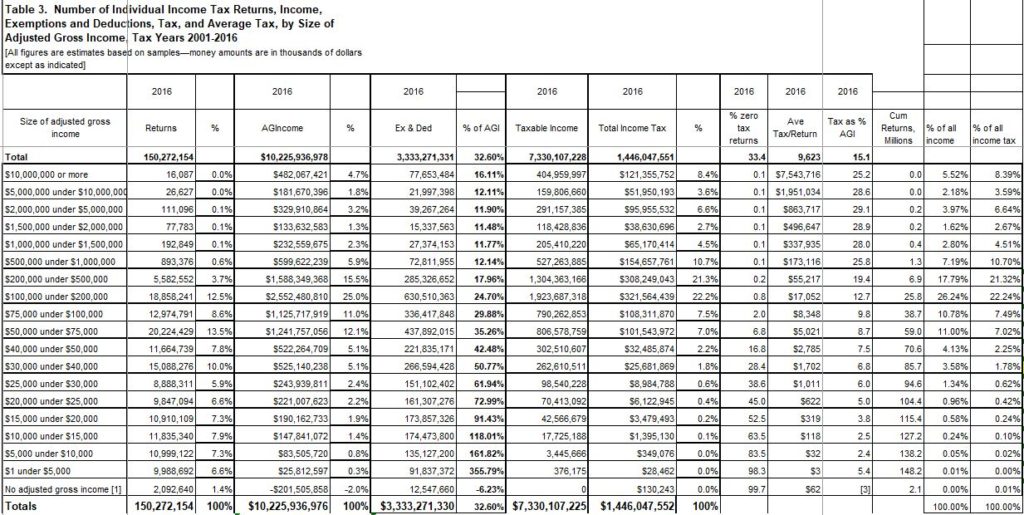
- There were 150M tax returns filed, about one for every 2.2 persons. That makes sense for a population of about 330M and with tax returns often being for households/families rather than just for individuals.
- Total adjusted gross income reported was $10.2 trillion dollars, an average of about $68,000 per return.
- The median income, half higher and half lower, was in the $30,000 to $40,000 bracket. On a per capita basis, this defines the so-called Middle Class. That is a large and disturbing difference between the average and the median.
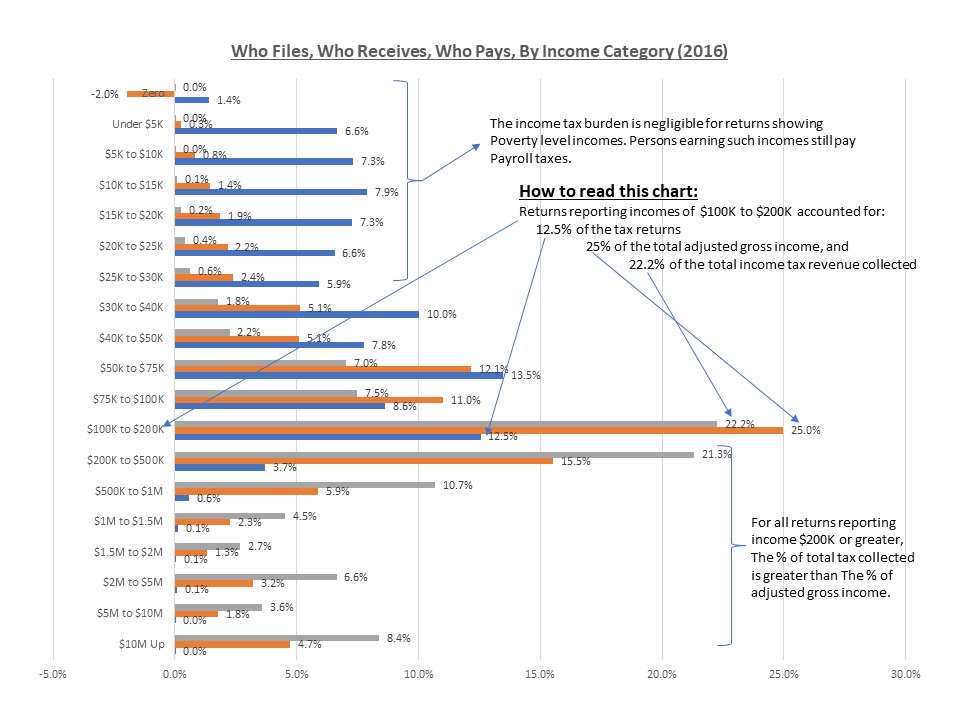
- Returns showing AGI less than $30,000, below Middle Class, accounted for only 7% of the AGI and 1.4% of income tax collected.
- Returns showing AGI greater than $40,000, above Middle Class, accounted for 88% of the AGI and 97% of the income tax collected. Is that a “fair share?”
- Total income tax reported was $1.45 trillion dollars, about 14% of the total adjusted gross income and a little less than $10,000 per return. (It is interesting to compare this figure with the $1.98 trillion total personal tax reported in the BEANIPA tables for 2016. I suppose the BEANIPA figure is based on actual collections including withholding, late payments, etc. while the IRS is based on bills presented. Still that seems to be a large difference.)
The high percentage of low-income people is even worse than the tax return data indicate because millions of low-income people are not required to file a return. Those include:
- Single people under 65 with gross income less than $12,000
- Single people 65 or older with gross income less than $13,300
- Married couples under 65, filing jointly, with incomes less than $24,000
- Married couples 65 or older, filing jointly, with incomes less than $26,600
- Married couples filing separately with incomes less than $5.00. ??
- Heads of Household under 65 with incomes less than $18,000
- Heads of Household 65 or older with incomes less than $19,600
- Qualifying widows or widowers under 65 with incomes less than $24,000
- Qualifying widows or widowers 65 or older with incomes less than $25,300
- And to top off the complications, Social Security doesn’t count or gets reduced depending on other income.
This is just a hint at how complicated the tax code is!
So, in the interest of simplification, let’s ask an interesting “What if?”
What if a flat tax of 10% on all AGI below $100,000, 15% on all AGI between $100,000 and $500.000 and 20% on all AGI above $500,000, with no exemptions, exclusions, deductions or credits (and no entanglement with the ACA or welfare or education) were charged, the total collected would have been almost exactly the same as collected under the current absurdly complex system but with no tax returns required except for self employed folks and businesses. For most of us, the correct taxes would be withheld from our pay and pensions and dividends and capital gains, and that would be the end of the process. Same rate on everything. No game playing and picking of winners and losers.
The IRS would shrink. Congress would have to quit playing games with special favors for some groups and punishments for others and would have to tell all of us when they were raising taxes and how much and why. For most of us, tax returns would not be on post cards. They would be non-existent. Even those millions not paying now would get the 10% deducted from all but Social Security.
And, yes, I would have had to pay a little more. But I would have suffered much less hassle, would have been more carefree, and could have spent more time doing something worthwhile. And perhaps the national debt would have grown less.
And Congress could have spent more time on critical issues and less time fiddling with the tax code in search of votes.
And, by the way, the same simplification is needed on corporate taxes: just a flat 15% rate on profits reported to the public, no exemptions, exclusions, deductions, credits, or allowances. Period.
For those who prefer charts and tables over words, below are some that can be used to craft other proposals.