We are heavily entangled with, both supporting and depending on, two very large entities that we hope and pray are too large to fail. Unfortunately, those two large entities are also entangled with, supporting and depending on, each other, and the inevitable conflicts of interest combined with short term thinking and selfish behaviors have weakened both. The two entities are the United States Federal Government and the United States Economy.
Anyone responsible for an important enterprise must understand how the enterprise works and how well it is doing. An important first step in managing and driving improvement is establishment of KRM’s, Key Result Measures, for the enterprise. Such measures must be carefully selected and based on accurate data designed to identify important trends and statistically significant changes. Such tools greatly facilitate diagnosis of problems and planning, implementation, and documentation of improvement projects.
In the charts below, you will see the results of an effort to identify high level measures for these two major entities. For all these variables, I plotted data from 1960 through 2014, the last full year for which government supplied data are available. I used ten year running averages because such averages eliminate noise and make each point very accurate, containing a lot of data, and because I didn’t want to be accused of trying to correlate ups and downs with presidential terms. We attribute far too much of the good and bad news about our government and our economy to whoever happens to be in office. The actions a current administration or congress might take are far more likely to take effect a few years down the road rather than immediately. Our economic ship and our government ship are big and bulky and slow to turn.
The most important measures are the size and growth rate of our economy. After that, the issues are how much of that economy is consumed by the federal government, how the money to fund the government is pulled from the economy, and how that money is spent by the federal government. Some of these measures are controllable factors, independent variables, and some are lagging results or dependent variables.
Variables that can be controlled over time
- Spending as a percent of GDP
- Percent of spending available for transfer payments
- Percent of revenue coming from income, payroll, corporate, and other taxes.
Variables that are lagging and dependent
- Total federal debt as a percent of GDP
- GDP growth rate
The charts below indicate that we have opportunities with all three independent variables, one of them in serious trouble, and major problems with both dependent variables:
- A rapidly diminishing portion of our federal spending going to infrastructure and other key economic support items and a rapidly increasing portion going to transfer payments.
- Unwillingness to match spending and taxing and resulting in accumulation of unsustainable debt, now roughly equal to GDP.
- A corporate tax structure that advertises ridiculously high rates and motivates game playing to reduce the tax bills with the result that high rates are delivering low tax revenues even while complicating and discouraging business.
- GDP growth is in a long term consistent downward trend.
Click on the charts to read the explanation. The suggested “targets” are mine.
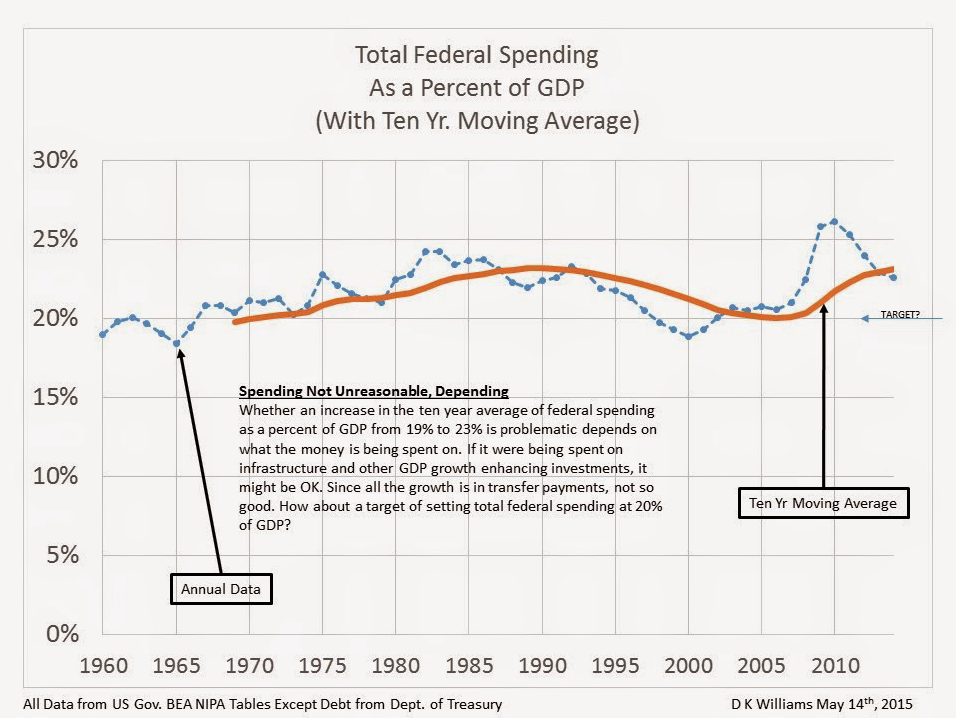
Chart 1 – This is probably not increasing as fast as many people suspect and has actually been relatively constant over the decades. Let’s just agree that 20% of GDP is a reasonable target for federal spending. Of course we don’t know what the GDP is until the year is over but adjustments for misses can be made in the following year so that the long term average homes in on 20%.
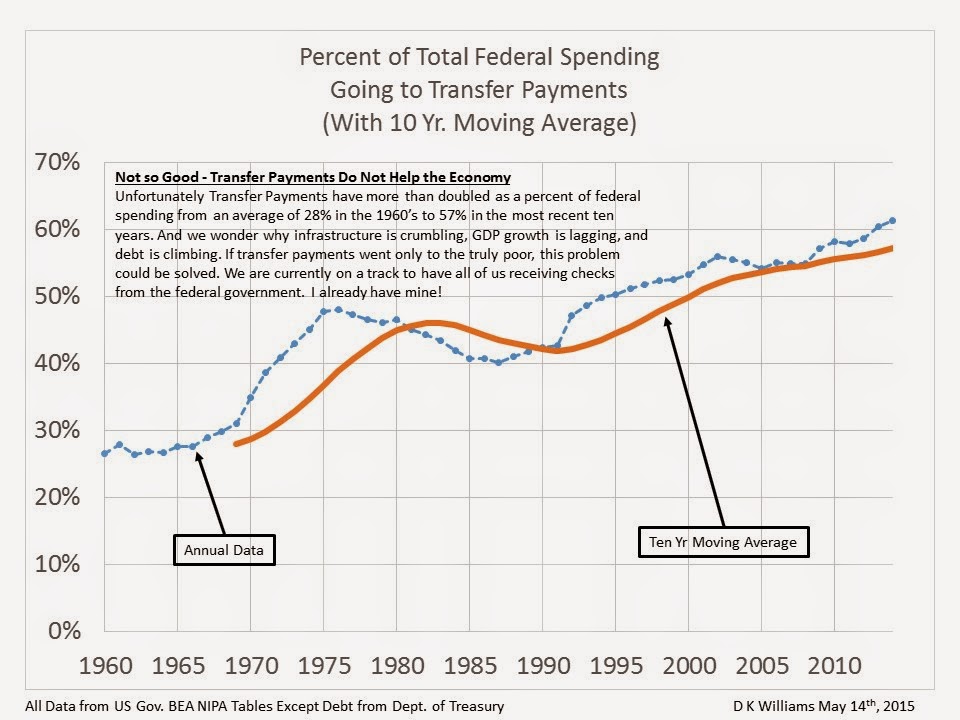
Chart 2 – This disastrous trend, so-called entitlement spending, is starving the federal government of funds needed for investment in infrastructure and other business and investment stimulating projects. Taking money from one pocket and putting it in another solves no long term problems, not even poverty.
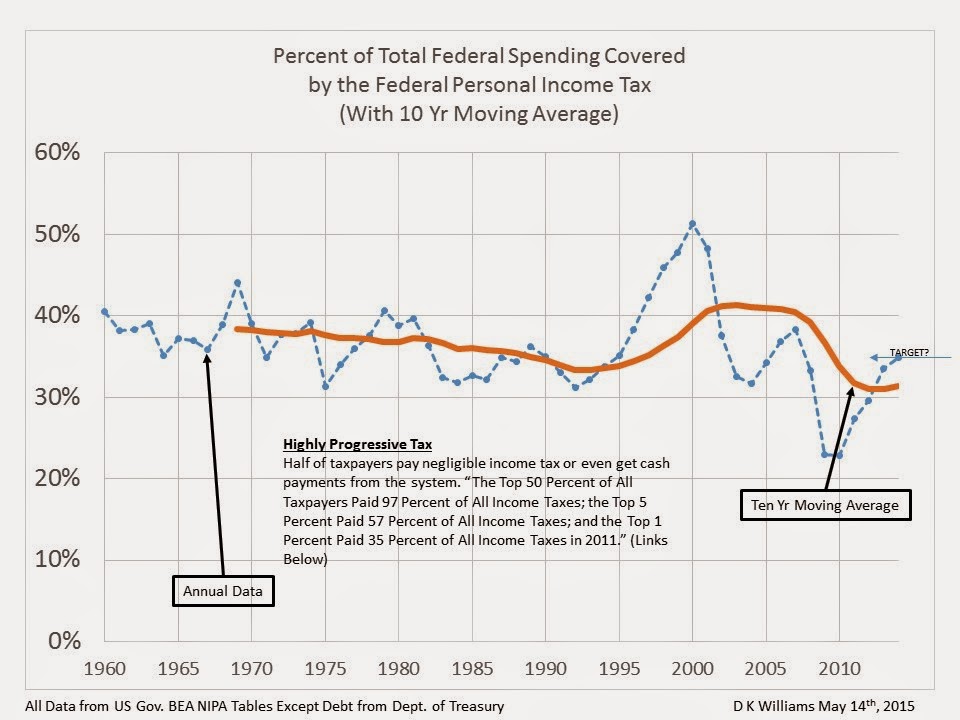
Chart 3 – Income tax coverage is much narrower than in past decades with about half having little or no liability. We need lower rates with broader participation and no special treatment. A flat 15% on all earned income above poverty level would just about do it. And it would eliminate the need for tax returns on earned income and almost put the IRS out of business.
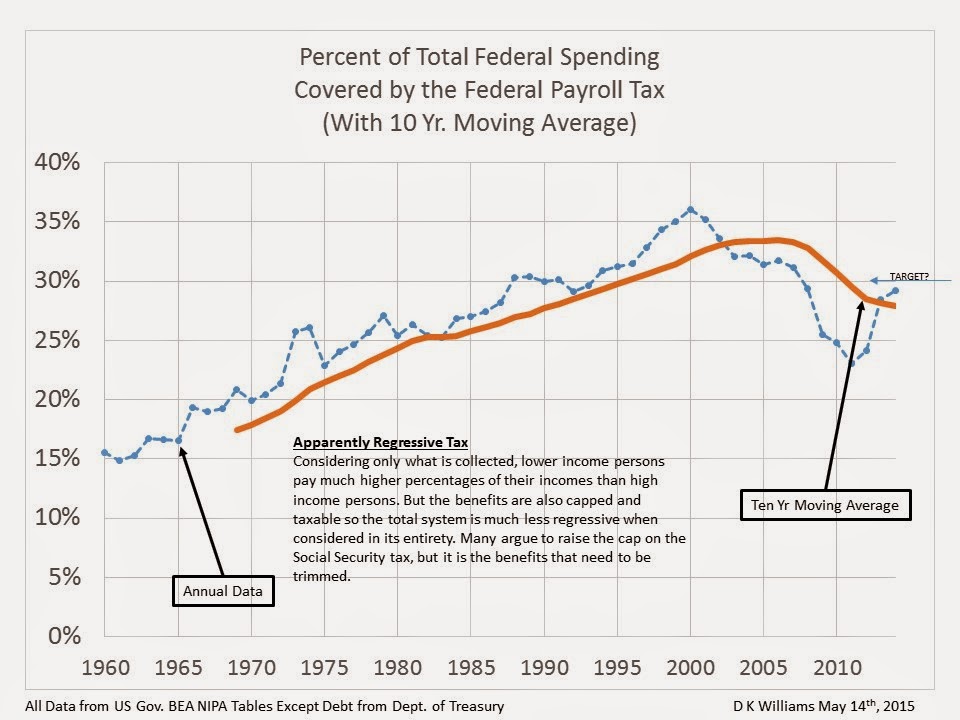
Chart 4 – This apparently regressive tax is excessive and falling short of the poorly conceived promises made to those paying it. (I say apparently because, while the taxes hit lower income folks harder, the benefits also strongly favor them, thus making the overall system less regressive. Very little contribution is required to get benefits, and benefits are capped.) Some argue to raise the tax. It would be far wiser to reduce the benefits based on means testing and run less rather than more money through Washington DC. Read more here.
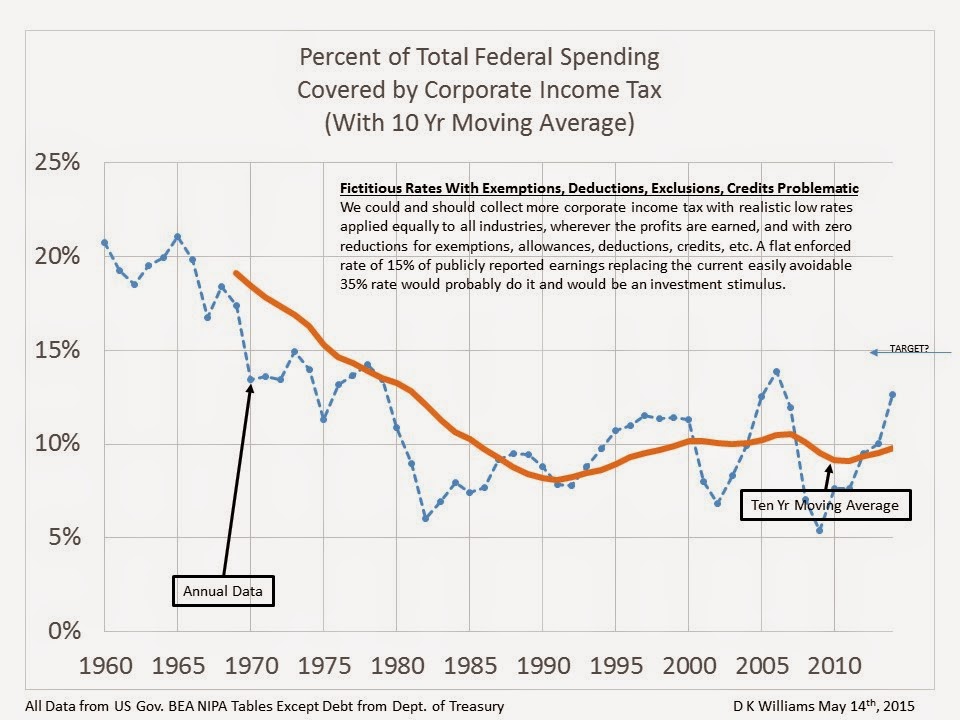
Chart 5 – The unholy trinity of business, lobbyists, and congress has resulted in an incomprehensible corporate tax system that is difficult for all, fair to none, and expensive to maintain. A flat rate of 15% to 20% on publicly reported earnings before taxes would stimulate business and investment, put thousands of lobbyists out of business, let executives focus on their businesses rather than on pursuit of special tax treatment, raise more money, and give congress time to worry about important issues rather than where their next campaign funds are coming from.
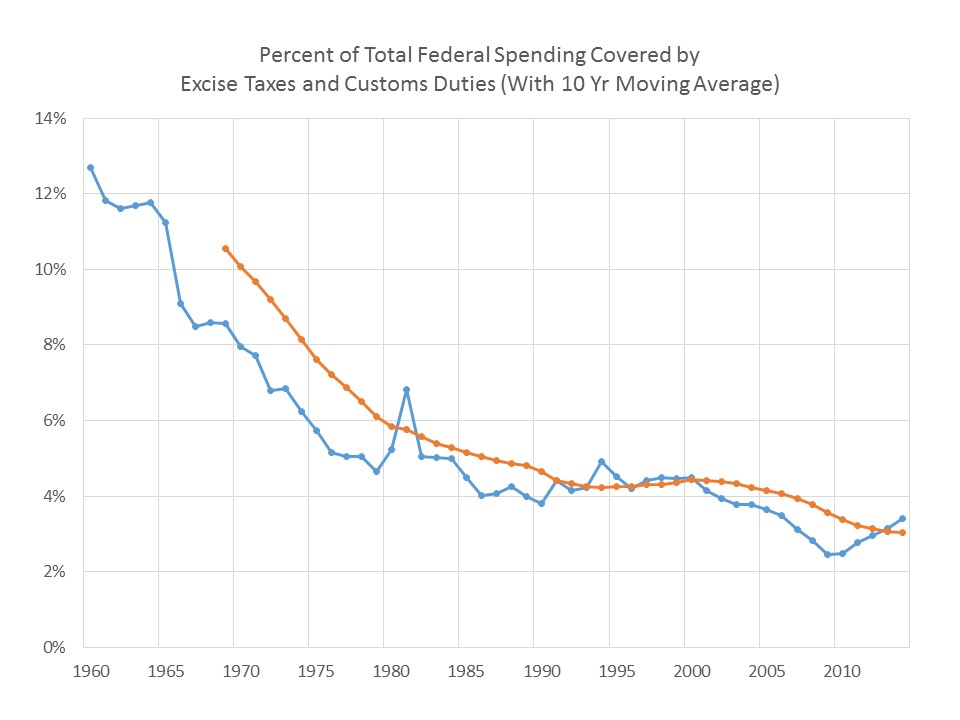
Chart 6 – Not only has the corporate tax contribution to federal spending been reduced significantly, the tax revenues from customs and excise taxes has been decreased from funding more than 10% of federal spending to around 3%. This must be a result of the free trade policies implemented over the recent decades.
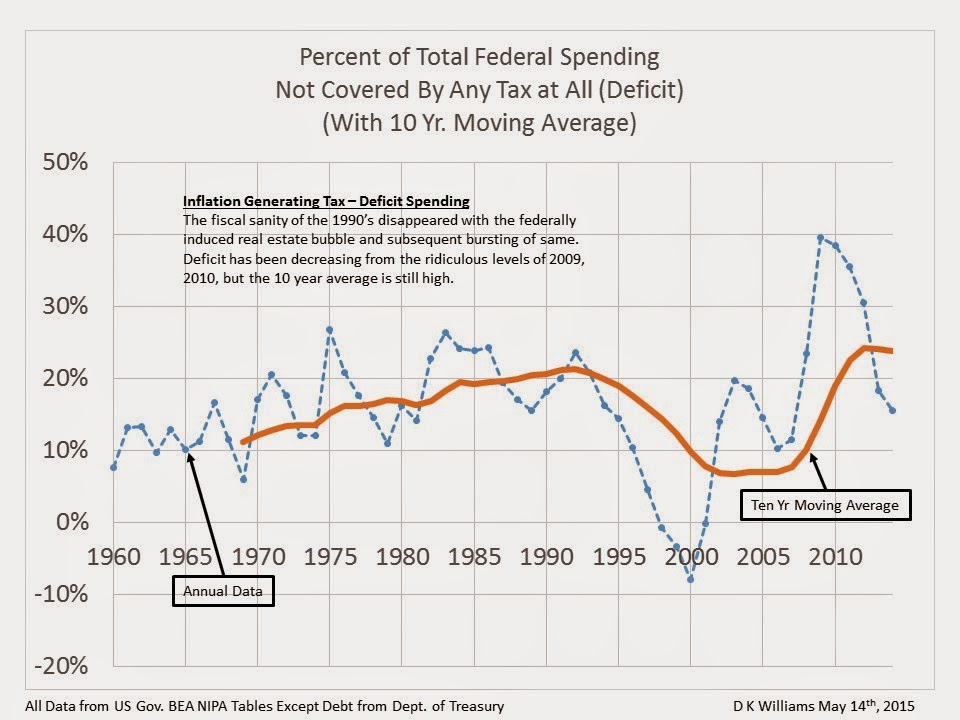
Chart 7 – Over the last ten years we have borrowed more than 20% of all the money spent by the federal government! And this for the wealthiest nation on Earth! This is a ridiculous picture of administrations and congresses from both parties over six decades consistently running deficits that pile on debt. The only exception was at the turn of the century when tax revenues from the dot.com bubble boosted revenues even as the associated false prosperity enabled some spending cuts.
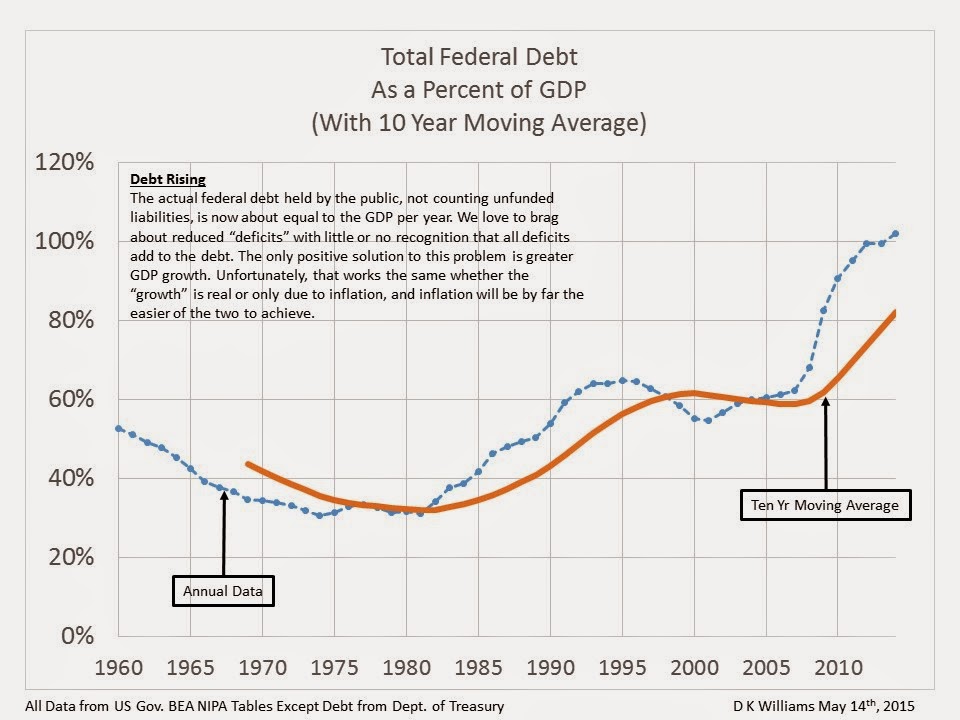
Chart 8 – The last good years were when we all worked very hard to pay off the burdensome debt incurred during WWII. That favorable trend ended in the 1970’s with the first oil crunch and the end of $3 per barrel oil.
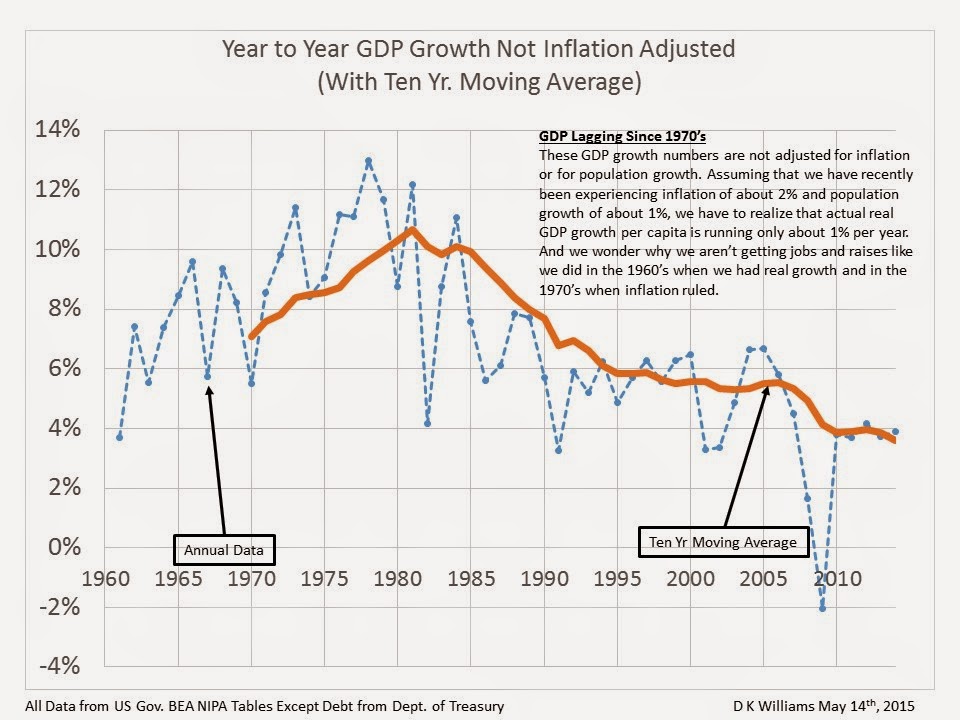
Chart 9 – This GDP trend is a sorry and discouraging picture, proving the futility of the borrowing and spending strategy of the past decades, but does not present a situation without hope.
Here are the actions we need to take to right the ship and change the trends on GDP growth and Federal Debt.
- Reform corporate taxes to establish a new low competitive rate that every corporation pays, no favors allowed. Something in the range of 15 to 20% on all publicly reported profits, wherever earned, should do it.
- Reform our social welfare programs, Social Security and Medicare, to stop paying bills for and sending checks to people who can afford to pay their own bills with their own income.
- Limit Federal Government spending to 20% of GDP and fund 20% of it from corporate income taxes, 35% from personal income taxes, 35% from the payroll tax, and the remainder from excise and customs taxes and various fees.
- It will take a while to kick in, but we would know this strategy has been successful if the GDP moving average and the federal debt curves change direction. Of course there would be earlier indicators such as more positive attitudes, more investment, better individual quarter measurements, etc., but, if we celebrate those, declare victory, and stop the improvement efforts, all will be lost. Solving these problems will require an extended attention span.